【JavaScript】勝率をグラフ化して結果をツイートできるじゃんけんアプリを作ったよ【Chart.js】

プログラミング学習初心者向けのジャンケンアプリを元にちょっとずつ機能を足していくことで勉強しようと思ってやってみました。
こんなアプリ
デモサイト:https://senri-git.github.io/janken/
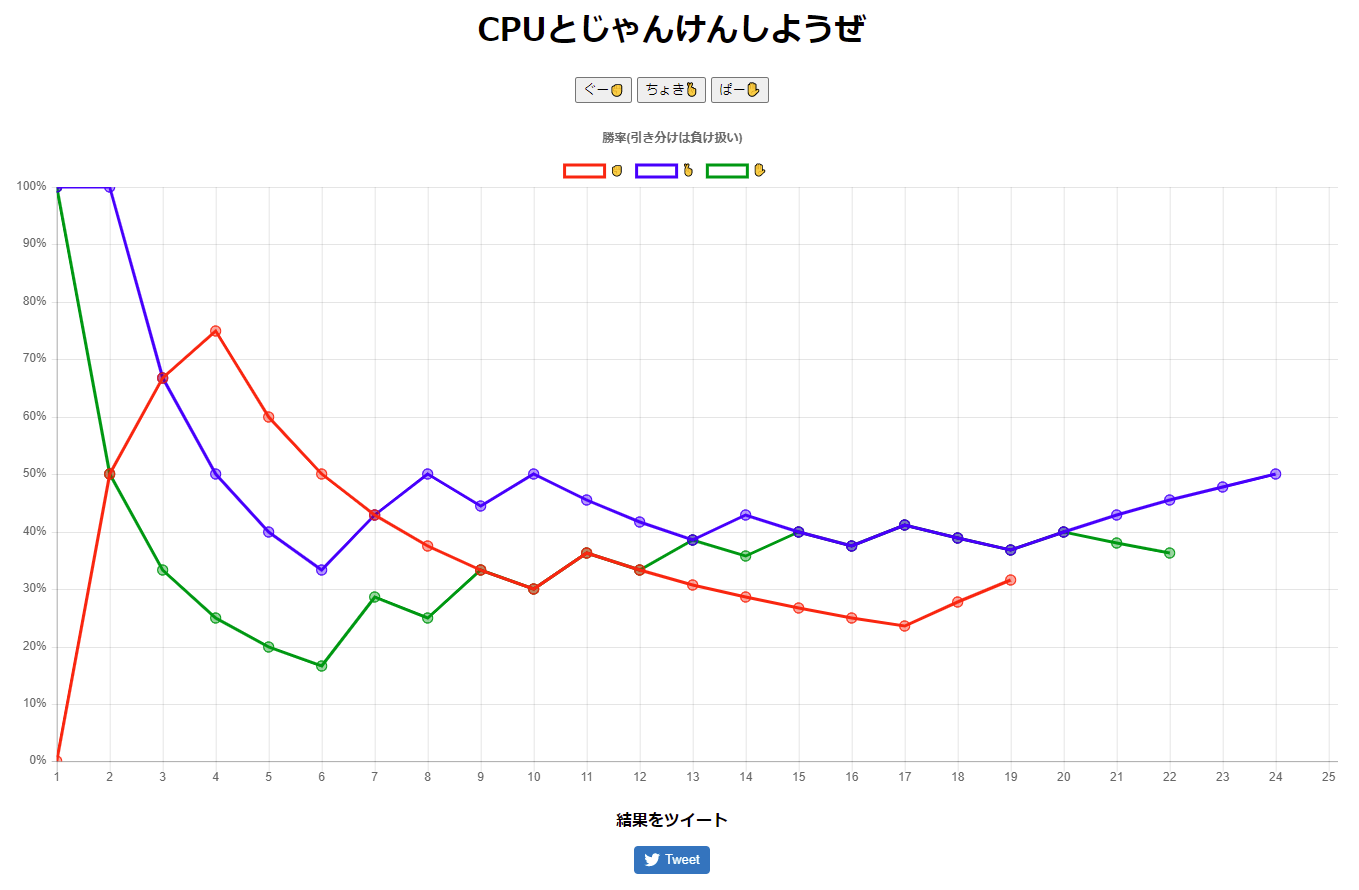
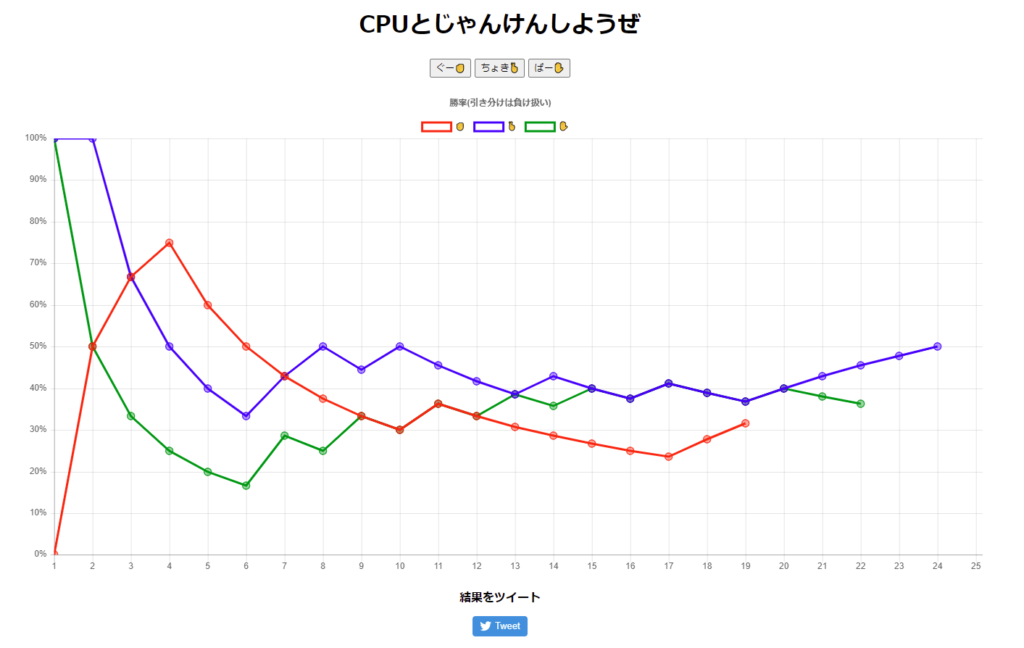
CPUとじゃんけんして、✊✌✋それぞれの勝率の推移をグラフに表示してくれます。

勝ち、引き分け、負けのどれかなので勝つ確率は33.33…%に収束するはずですね!

結果をTweetするボタンも設置してみました。Tweetボタンを押すとTwitterの投稿画面が開き、画像のように勝率を含むテキストが入ります。

じゃんけん機能の実装
じゃんけん機能のみ実装したのが下記コード
<!DOCTYPE html>
<html lang="ja">

<head>
  <meta charset="UTF-8">
  <meta http-equiv="X-UA-Compatible" content="IE=edge">
  <meta name="viewport" content="width=device-width, initial-scale=1.0">
  <title>じゃんけん</title>
</head>

<body>

  <h1>CPUとじゃんけんしようぜ</h1>
  <div class="buttons">
    <input type="button" value="ぐー✊" onclick="janken(0)">
    <input type="button" value="ちょき🤞" onclick="janken(1)">
    <input type="button" value="ぱー✋" onclick="janken(2)">
  </div>

  <script src="main.js"></script>
</body>

</html>
const choice = ['ぐー✊', 'ちょき✌', 'ぱー✋'];
const msgJudge = ["引き分け😑", "勝利!😄🎊🎊", "負け😧"];
// 0~maxの整数で乱数生成
function getRandomInt(max) {
return Math.floor(Math.random() * Math.floor(max));
}
// 判定
function judge(yourChoice, cpuChoice) {
if (yourChoice == cpuChoice) {//相子パターン
return 0;
} else if (yourChoice == cpuChoice - 1 || (yourChoice == choice.length - 1 && cpuChoice == 0)) {// 勝ちパターン
return 1;
} else {// 負けパターン
return 2;
}
}
// じゃんけん実行
function janken(yourChoice) {
// 乱数生成
cpuChoice = getRandomInt(3);
// 勝敗判定
nJudge = judge(yourChoice, cpuChoice);
// 結果表示
alert("YOU : " + choice[yourChoice] + "\n" + "CPU : " + choice[cpuChoice] + "\n\n" + msgJudge[nJudge]);
}↓こんな感じにボタンが並ぶ。

押すとじゃんけんが実行される。

判定方法はいろいろ考えられますが今回は下記の考え方で作ってみました。
【勝敗判定の考え方】
0…ぐー 1…ちょき 2…ぱー とすると
相子:自分の選択と相手の選択が同じ
勝ち:「 自分の選択 = 相手の選択 – 1 」または「 自分の選択 = 2 且つ 相手の選択 = 0 」
負け:上記以外

昔小学校で流行った「ぐー✊、ちょき✌、ぱー✋、ほげ🤟、ふー👌」のジャンケンも実装できるかの?

そんなジャンケン知りません…
グラフ表示機能実装
グラフを実装した結果が下記コード(サイズ等は最後にCSSで整えます)
<!DOCTYPE html>
<html lang="ja">

<head>
  <meta charset="UTF-8">
  <meta http-equiv="X-UA-Compatible" content="IE=edge">
  <meta name="viewport" content="width=device-width, initial-scale=1.0">
  <title>じゃんけん</title>
</head>

<body>

  <h1>CPUとじゃんけんしようぜ</h1>
  <div class="buttons">
    <input type="button" value="ぐー✊" onclick="janken(0)">
    <input type="button" value="ちょき🤞" onclick="janken(1)">
    <input type="button" value="ぱー✋" onclick="janken(2)">
  </div>

  <canvas id="myLineChart"></canvas>

  <script src="https://cdnjs.cloudflare.com/ajax/libs/Chart.js/2.1.4/Chart.min.js"></script>
  <script src="main.js"></script>

</body>

</html>
const choice = ['ぐー✊', 'ちょき✌', 'ぱー✋'];
const msgJudge = ["引き分け😑", "勝利!😄🎊🎊", "負け😧"];
let sumUse = [0, 0, 0];// ぐー、ちょき、ぱーの使用回数
let sumWin = [0, 0, 0];// ぐー、ちょき、ぱーの勝利回数
let rateWin = [[], [], []];// ぐー、ちょき、ぱーの勝率推移
let labelX = [1, 2, 3, 4, 5, 6, 7, 8, 9, 10];// グラフX軸ラベル
let myLineChart = 0;// // インスタンス生成用
// 0~maxの整数で乱数生成
function getRandomInt(max) {
return Math.floor(Math.random() * Math.floor(max));
}
// 判定
function judge(yourChoice, cpuChoice) {
if (yourChoice == cpuChoice) {//相子パターン
return 0;
} else if (yourChoice == cpuChoice - 1 || (yourChoice == choice.length - 1 && cpuChoice == 0)) {// 勝ちパターン
return 1;
} else {// 負けパターン
return 2;
}
}
// じゃんけん実行
function janken(yourChoice) {
// 乱数生成
cpuChoice = getRandomInt(3);
// 勝敗判定
nJudge = judge(yourChoice, cpuChoice);
// 結果表示
alert("YOU : " + choice[yourChoice] + "\n" + "CPU : " + choice[cpuChoice] + "\n\n" + msgJudge[nJudge]);
// 使った数カウント
sumUse[yourChoice]++;
// 勝った数カウント
if (nJudge == 1) {
sumWin[yourChoice]++;
}
// 勝率計算
rateWin[yourChoice].push(Math.round(10000 * sumWin[yourChoice] / sumUse[yourChoice]) / 100);//勝率(%) 小数第2位まで
// 横軸追加
if (rateWin[yourChoice].length == labelX.length) {
labelX.push(labelX.length + 1);
}
// グラフ更新
drawChart();
}
// グラフ出力関数
function drawChart() {
var ctx = document.getElementById("myLineChart");
// すでにグラフ(インスタンス)が生成されている場合は、グラフを破棄する
// 公式ドキュメント https://misc.0o0o.org/chartjs-doc-ja/developers/api.html#destroy
if (myLineChart) {
myLineChart.destroy();
}
myLineChart = new Chart(ctx, {// インスタンスをグローバル変数で生成
type: 'line',
data: {
labels: labelX,
datasets: [
{
label: '✊ ',
data: rateWin[0],
lineTension: 0,
borderColor: "rgba(255,0,0,1)",
backgroundColor: "rgba(0,0,0,0)",
pointBackgroundColor: "rgba(255,0,0,.4)",
pointRadius: 5
},
{
label: '🤞 ',
data: rateWin[1],
lineTension: 0,
borderColor: "rgba(0,0,255,1)",
backgroundColor: "rgba(0,0,0,0)",
pointBackgroundColor: "rgba(0,0,255,.4)",
pointRadius: 5
},
{
label: '✋ ',
data: rateWin[2],
lineTension: 0,
borderColor: "rgba(0,150,0,1)",
backgroundColor: "rgba(0,0,0,0)",
pointBackgroundColor: "rgba(0,150,0,.4)",
pointRadius: 5
}
],
},
options: {
animation: {
duration: 0, // アニメーションの時間
},
title: {
display: true,
text: '勝率(引き分けは負け扱い)'
},
scales: {
yAxes: [{
ticks: {
suggestedMax: 100,
suggestedMin: 0,
stepSize: 10,
callback: function (value, index, values) {
return value + '%'
}
}
}]
},
}
});
}
// グラフ初期表示
drawChart();勝率推移の変数のデータ構造
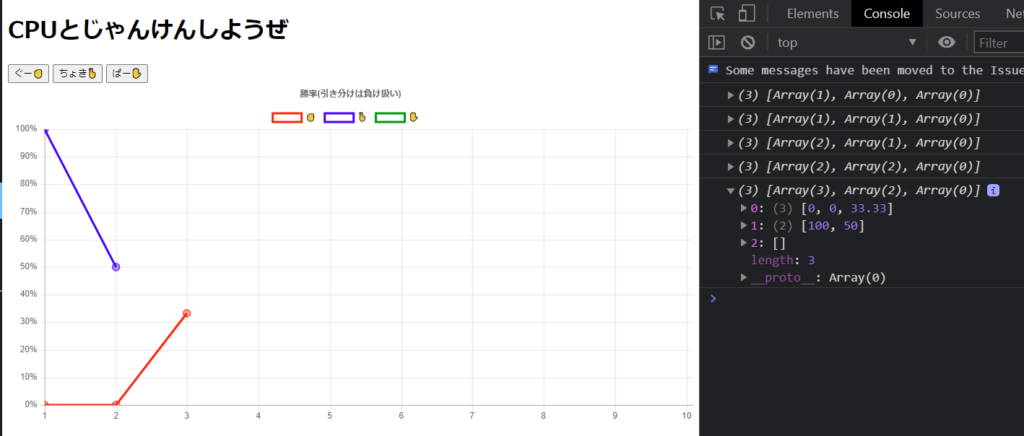
勝率推移を格納する変数rateWinは2次元配列にしたのでデータ構造がややこしいかもしれませんが、console.logで出力させると分かりやすいかもしれません。
console.log(rateWin);//function janken(yourChoice){}の中に入れて確認してみる
上の画像だとrateWin = [ [0,0,33.33], [100,50], [] ]ということですね。
グラフ表示
グラフ表示はChart.jsを使用しました。上記コードだとボタンを押すたびにインスタンス生成されるのでdestroy()を使って破棄する処理を入れています。公式ドキュメントにも必要性が記載されていました。
.destroy()
これを使用すると、作成されたチャートインスタンスを破棄します。これにより、Chart.js内のチャートオブジェクトに格納されているすべての参照が、Chart.jsにアタッチされた関連するイベントリスナと共にクリーンアップされます。 これは、キャンバスを新しいチャートに再利用する場合は、その前に呼び出す必要があります。
https://misc.0o0o.org/chartjs-doc-ja/developers/api.html#destroy
optionsでduration: 0を指定することでアニメーションを無しにしたりlineTension: 0,で折れ線が曲線にならないようにしたりと表示を整えています。
勝率は33.33333..%にならないように小数第二位まで表示することにしました。桁数指定方法の参考記事はこちら
横軸は初期表示ではMAX10まで表示しています。折れ線が9までいったら横軸のMAXが11になるように要素を追加しています。(常に右端が空いてる状態)
【ポイントまとめ】
- HTMLで
canvasを使用&「Chart.min.js」読み込み - グラフ更新する時に
destroy()でインスタンス破棄 Math.round()を使って四捨五入push()で配列末尾に要素追加
ツイートボタン実装
ツイートボタンを実装した結果が下記コード
<!DOCTYPE html>
<html lang="ja">

<head>
  <meta charset="UTF-8">
  <meta http-equiv="X-UA-Compatible" content="IE=edge">
  <meta name="viewport" content="width=device-width, initial-scale=1.0">
  <title>じゃんけん</title>
</head>

<body>

  <h1>CPUとじゃんけんしようぜ</h1>
  <div class="buttons">
    <input type="button" value="ぐー✊" onclick="janken(0)">
    <input type="button" value="ちょき🤞" onclick="janken(1)">
    <input type="button" value="ぱー✋" onclick="janken(2)">
  </div>
  <canvas id="myLineChart"></canvas>
  <h2>結果をツイート</h2>
  <div id="tweet-area">
    <!-- ここにボタンができる-->
  </div>
  <script src="https://platform.twitter.com/widgets.js" charset="utf-8"></script>
  <script src="https://cdnjs.cloudflare.com/ajax/libs/Chart.js/2.1.4/Chart.min.js"></script>
  <script src="main.js"></script>

</body>

</html>
const choice = ['ぐー✊', 'ちょき✌', 'ぱー✋'];
const msgJudge = ["引き分け😑", "勝利!😄🎊🎊", "負け😧"];
let sumUse = [0, 0, 0];// ぐー、ちょき、ぱーの使用回数
let sumWin = [0, 0, 0];// ぐー、ちょき、ぱーの勝利回数
let rateWin = [[], [], []];// ぐー、ちょき、ぱーの勝率推移
let labelX = [1, 2, 3, 4, 5, 6, 7, 8, 9, 10];// グラフX軸ラベル
let myLineChart = 0;// // インスタンス生成用
// 0~maxの整数で乱数生成
function getRandomInt(max) {
return Math.floor(Math.random() * Math.floor(max));
}
// 判定
function judge(yourChoice, cpuChoice) {
if (yourChoice == cpuChoice) {//相子パターン
return 0;
} else if (yourChoice == cpuChoice - 1 || (yourChoice == choice.length - 1 && cpuChoice == 0)) {// 勝ちパターン
return 1;
} else {// 負けパターン
return 2;
}
}
// じゃんけん実行
function janken(yourChoice) {
// 乱数生成
cpuChoice = getRandomInt(3);
// 勝敗判定
nJudge = judge(yourChoice, cpuChoice);
// 結果表示
alert("YOU : " + choice[yourChoice] + "\n" + "CPU : " + choice[cpuChoice] + "\n\n" + msgJudge[nJudge]);
// 使った数カウント
sumUse[yourChoice]++;
// 勝った数カウント
if (nJudge == 1) {
sumWin[yourChoice]++;
}
// 勝率計算
rateWin[yourChoice].push(Math.round(10000 * sumWin[yourChoice] / sumUse[yourChoice]) / 100);//勝率(%) 小数第2位まで
let rateWinTail = ['-', '-', '-']
for (i = 0; i < 3; i++) {
if (rateWin[i] != '') {
rateWinTail[i] = rateWin[i][rateWin[i].length - 1];
}
}
// 横軸追加
if (rateWin[yourChoice].length == labelX.length) {
labelX.push(labelX.length + 1);
}
// グラフ更新
drawChart();
// Tweetボタン更新
setTweetButton("勝率は、✊" + rateWinTail[0] + "%, ✌" + rateWinTail[1] + "%, ✋" + rateWinTail[2] + "% でした!");
}
// グラフ出力関数
function drawChart() {
var ctx = document.getElementById("myLineChart");
// すでにグラフ(インスタンス)が生成されている場合は、グラフを破棄する
// 公式ドキュメント https://misc.0o0o.org/chartjs-doc-ja/developers/api.html#destroy
if (myLineChart) {
myLineChart.destroy();
}
myLineChart = new Chart(ctx, {// インスタンスをグローバル変数で生成
type: 'line',
data: {
labels: labelX,
datasets: [
{
label: '✊ ',
data: rateWin[0],
lineTension: 0,
borderColor: "rgba(255,0,0,1)",
backgroundColor: "rgba(0,0,0,0)",
pointBackgroundColor: "rgba(255,0,0,.4)",
pointRadius: 5
},
{
label: '🤞 ',
data: rateWin[1],
lineTension: 0,
borderColor: "rgba(0,0,255,1)",
backgroundColor: "rgba(0,0,0,0)",
pointBackgroundColor: "rgba(0,0,255,.4)",
pointRadius: 5
},
{
label: '✋ ',
data: rateWin[2],
lineTension: 0,
borderColor: "rgba(0,150,0,1)",
backgroundColor: "rgba(0,0,0,0)",
pointBackgroundColor: "rgba(0,150,0,.4)",
pointRadius: 5
}
],
},
options: {
animation: {
duration: 0, // アニメーションの時間
},
title: {
display: true,
text: '勝率(引き分けは負け扱い)'
},
scales: {
yAxes: [{
ticks: {
suggestedMax: 100,
suggestedMin: 0,
stepSize: 10,
callback: function (value, index, values) {
return value + '%'
}
}
}]
},
}
});
}
// twitter ボタン
// 任意のタイミングで呼べば狙ったとおりのテキストのボタンつくれる
function setTweetButton(text) {
document.querySelector('#tweet-area').textContent = '';//既存のボタン消す
// htmlでスクリプトを読んでるからtwttがエラーなく呼べる
twttr.widgets.createShareButton(
"",
document.getElementById("tweet-area"),
{
size: "large", //ボタンはでかく
text: text, // 狙ったテキスト
hashtags: "じゃんけん,Webアプリ", // ハッシュタグ
url: "//url"// URL
}
);
}
// グラフ初期表示
drawChart();
// Tweetボタン 初期表示
setTweetButton();これで必要な機能は揃いました。
結果をツイート内容に反映させる方法はこちらの記事を参考に作りました。(jQuery→バニラjsの変換になれていないのでそれもググりました😅)
ツイッターウィジェットのjsファイルを読み込むとき(<script src="https://platform.twitter.com/widgets.js" charset="utf-8"></script>の部分)にasync属性がついていると初期表示に失敗することがあるので注意。(MDNリファレンス:<script>: スクリプト要素)
Tweetボタンをオリジナルで作りたければ下記記事が参考になると思います。
ローカル変数rateWinTailはTweetテキストに挿入する用の変数です。rateWin[0],rateWin[1],rateWin[2]の末尾を取り出してくる処理を追加しました。初期値をlet rateWinTail = ['-', '-', '-']としておくことで、例えば「ぐー」しか使わなかったときの結果は「勝率は、✊20%、✌-%、✋-% 」のように表示することができます。
完成版ソースコード
最後に見た目を少し整えて完成です。
<!DOCTYPE html>
<html lang="ja">

<head>
  <meta charset="UTF-8">
  <meta http-equiv="X-UA-Compatible" content="IE=edge">
  <meta name="viewport" content="width=device-width, initial-scale=1.0">
  <link rel="stylesheet" href="style.css">
  <title>じゃんけん✊✌✋</title>
</head>

<body>

  <h1>CPUとじゃんけんしようぜ</h1>
  <div class="buttons">
    <input type="button" value="ぐー✊" onclick="janken(0)">
    <input type="button" value="ちょき🤞" onclick="janken(1)">
    <input type="button" value="ぱー✋" onclick="janken(2)">
  </div>

  <section class="chartContainer">
    <canvas id="myLineChart"></canvas>
  </section>

  <h2>結果をツイート</h2>
  <div id="tweet-area">
    <!-- ここにボタンができる-->
  </div>
  <script src="https://platform.twitter.com/widgets.js" charset="utf-8"></script>
  <script src="https://cdnjs.cloudflare.com/ajax/libs/Chart.js/2.1.4/Chart.min.js"></script>
  <script src="main.js"></script>
</body>

</html>
body {
text-align: center;
padding: 10px;
}
h1 span{
display: inline-block;
}
.chartContainer{
width: 95%;
margin: 0 auto;
overflow-x: scroll;
}
@media (min-width: 1024px) {
.chartContainer{
width: 70%;
overflow-x: visible;
}
}
@media (max-width: 1023px) {
#myLineChart {
min-width: 400px;
min-height: 200px;
}
}
.buttons {
margin-bottom: 40px;
}
h2{
font-size: 1rem;
}const choice = ['ぐー✊', 'ちょき✌', 'ぱー✋'];
const msgJudge = ["引き分け😑", "🎉🎉🎉勝利!😄🎊🎊", "負け😧"];
let sumUse = [0, 0, 0];// ぐー、ちょき、ぱーの使用回数
let sumWin = [0, 0, 0];// ぐー、ちょき、ぱーの勝利回数
let rateWin = [[], [], []];// ぐー、ちょき、ぱーの勝率推移
let labelX = [1, 2, 3, 4, 5, 6, 7, 8, 9, 10];// グラフX軸ラベル
let myLineChart = 0;// // インスタンス生成用
// 0~maxの整数で乱数生成
function getRandomInt(max) {
return Math.floor(Math.random() * Math.floor(max));
}
// 判定
function judge(yourChoice, cpuChoice) {
if (yourChoice == cpuChoice) {//相子パターン
return 0;
} else if (yourChoice == cpuChoice - 1
|| (yourChoice == choice.length - 1 && cpuChoice == 0)) {// 勝ちパターン
return 1;
} else {// 負けパターン
return 2;
}
}
// じゃんけん実行
function janken(yourChoice) {
// 乱数生成
cpuChoice = getRandomInt(3);
// 勝敗判定
nJudge = judge(yourChoice, cpuChoice);
// 結果表示
alert("YOU : " + choice[yourChoice] + "\n" + "CPU : " + choice[cpuChoice] + "\n\n" + msgJudge[nJudge]);
// 使った数カウント
sumUse[yourChoice]++;
// 勝った数カウント
if (nJudge == 1) {
sumWin[yourChoice]++;
}
// 勝率計算
rateWin[yourChoice].push(Math.round(10000 * sumWin[yourChoice] / sumUse[yourChoice]) / 100);//勝率(%) 小数第2位まで
let rateWinTail = ['-', '-', '-']
for (i = 0; i < 3; i++) {
if (rateWin[i] != '') {
rateWinTail[i] = rateWin[i][rateWin[i].length - 1];
}
}
// 横軸追加
if (rateWin[yourChoice].length == labelX.length) {
labelX.push(labelX.length + 1);
}
// グラフ更新
drawChart();
// Tweetボタン更新
setTweetButton("勝率は、✊" + rateWinTail[0] + "%, ✌" + rateWinTail[1] + "%, ✋" + rateWinTail[2] + "% でした!");
}
// グラフ出力関数
function drawChart(impression) {
var ctx = document.getElementById("myLineChart");
// すでにグラフ(インスタンス)が生成されている場合は、グラフを破棄する
// 公式ドキュメント https://misc.0o0o.org/chartjs-doc-ja/developers/api.html#destroy
if (myLineChart) {
myLineChart.destroy();
}
myLineChart = new Chart(ctx, {// インスタンスをグローバル変数で生成
type: 'line',
data: {
labels: labelX,
datasets: [
{
label: '✊ ',
data: rateWin[0],
lineTension: 0,
borderColor: "rgba(255,0,0,1)",
backgroundColor: "rgba(0,0,0,0)",
pointBackgroundColor: "rgba(255,0,0,.4)",
pointRadius: 5
},
{
label: '🤞 ',
data: rateWin[1],
lineTension: 0,
borderColor: "rgba(0,0,255,1)",
backgroundColor: "rgba(0,0,0,0)",
pointBackgroundColor: "rgba(0,0,255,.4)",
pointRadius: 5
},
{
label: '✋ ',
data: rateWin[2],
lineTension: 0,
borderColor: "rgba(0,150,0,1)",
backgroundColor: "rgba(0,0,0,0)",
pointBackgroundColor: "rgba(0,150,0,.4)",
pointRadius: 5
}
],
},
options: {
animation: {
duration: 0, // アニメーションの時間
},
title: {
display: true,
text: '勝率(引き分けは負け扱い)'
},
scales: {
yAxes: [{
ticks: {
suggestedMax: 100,
suggestedMin: 0,
stepSize: 10,
callback: function (value, index, values) {
return value + '%'
}
}
}]
},
}
});
}
// tweet ボタン
// 任意のタイミングで呼べば狙ったとおりのテキストのボタンつくれる
// 引数増やしていろいろやってもよい
function setTweetButton(text) {
// $('#tweet-area').empty();
document.querySelector('#tweet-area').textContent = '';//既存のボタン消す
// htmlでスクリプトを読んでるからtwttがエラーなく呼べる
twttr.widgets.createShareButton(
"",
document.getElementById("tweet-area"),
{
size: "large", //ボタンはでかく
text: text, // 狙ったテキスト
hashtags: "じゃんけん,Webアプリ", // ハッシュタグ
url: "//url"// URL
}
);
}
// グラフ初期表示
drawChart();
// Tweetボタン 初期表示
setTweetButton();まとめ
じゃんけんアプリを作るだけでも色々遊びながら新しい知識を補完していけることが分かりました。
【今回学んだこと】
- 乱数生成方法
- 配列操作
- 桁指定の四捨五入
- Chart.jsの使い方
- ツイートボタン設置方法
勉強になるので是非いろいろ改造してみてください!
参考サイト

